Reach and activation
Multiplying the number of users who adopt new features and create usage habits on a SaaS product
Product Design
Product Management
Figma
Vue
TailwindCSS
Linear
Mixpanel
Metabase
Overview
- Simplified a feature, redesigned to make it more prominent and added onboarding cues and a feedback loop. More users got to try the feature (1.5X) and kept using it afterwards (2X).
- Challenged the current activation metric and proposed a new one that better aligned with paid customers. Designed changes to promote relevant actions. More teams exhibited a desired behaviour (1.4X) and enabled a key activation feature (4X).
Understanding why a feature isn't used
Product data showed that a feature, which was expected to be an interesting addition, had a very small adoption and never really took off.
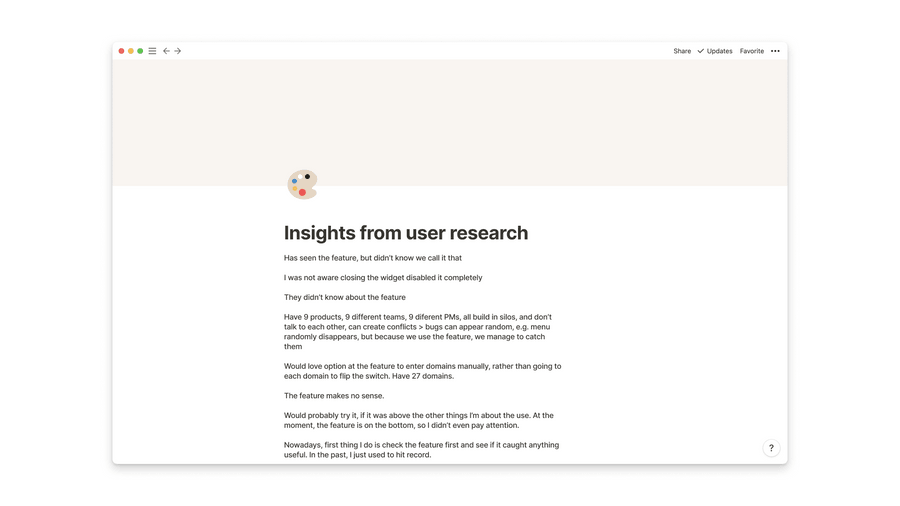
After more than 30h of user research interviews conducted reasoning was emerging on, among others, why the adoption of the feature wasn't as we expected.
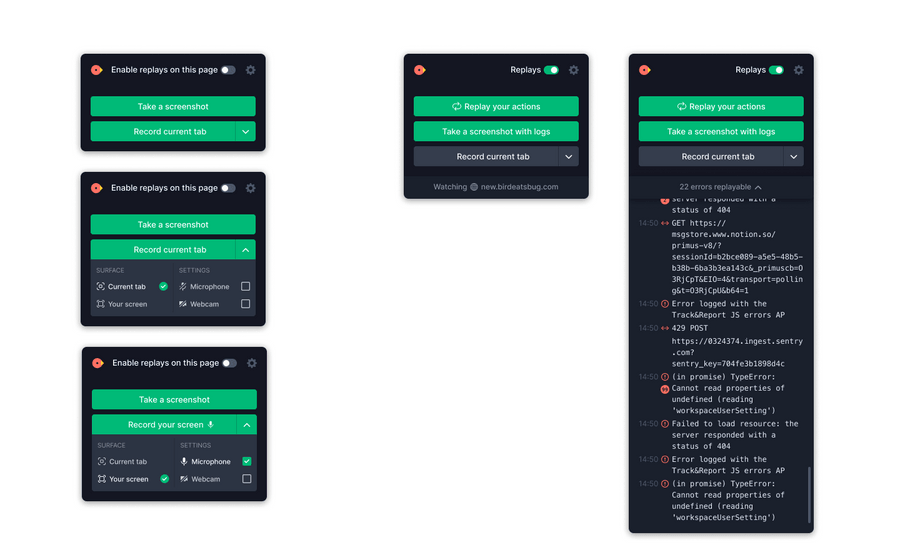
The consensus was that it was hard to start using it...
- As it requires that the user first enables one component on a given domain
- But it wasn't clearly stated at the browser extension that the component is opt-in by domain
- And the relationship between both components was also not clearly communicated
... and then really easy to dismiss and forget about it:
- Closing the browser extension widget (a shortcut to access the feature) disabled it entirely
- Re-enabling it meant fiddling with the extension settings
- Which left the user with only one way to access the feature: through the browser extension popup (where other competing features are located)
Moreover, one component of the feature was domain-based (which was praised by users), but the others were global. It was too easy to end up by mistake with just half of the feature enabled, which rendered it useless.
Designing for feature discovery
Work started with the following goals in mind:
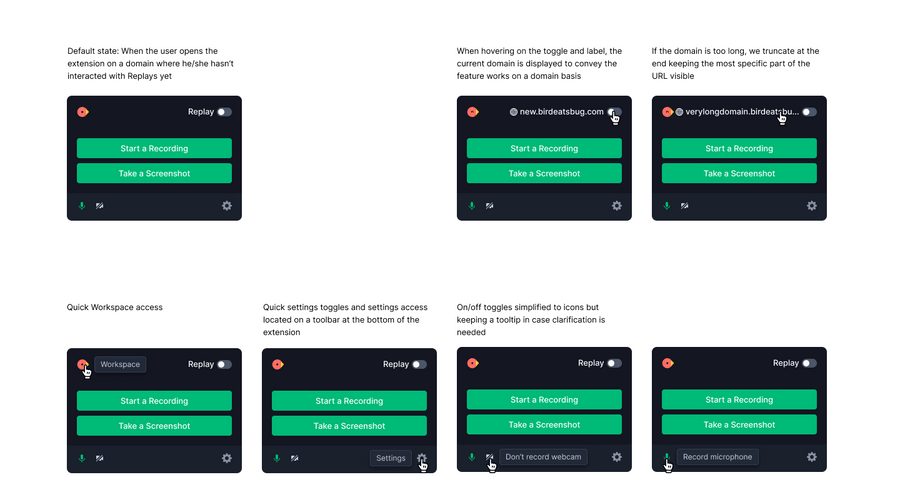
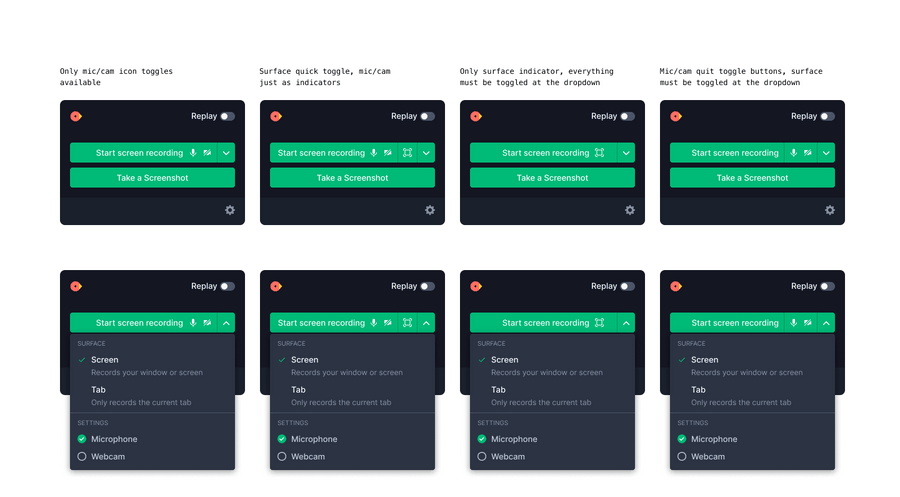
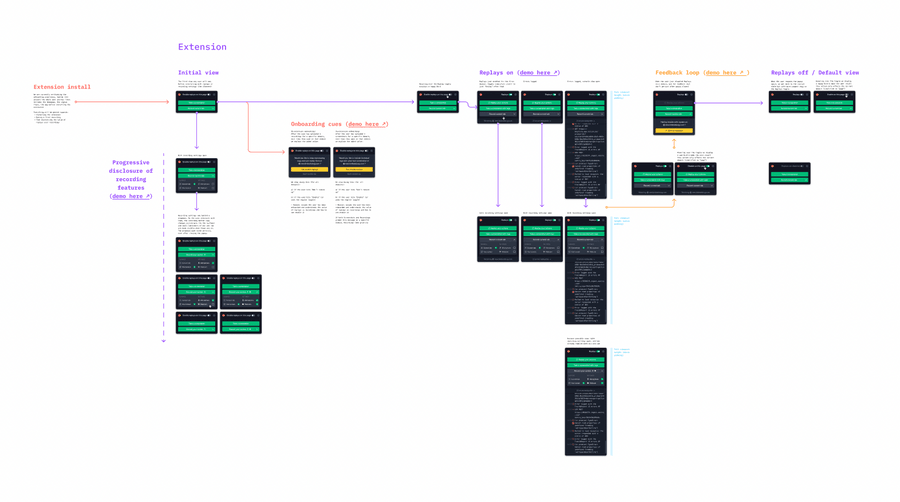
- Simplifying the feature by packaging everything together
- Giving more prominence to the feature
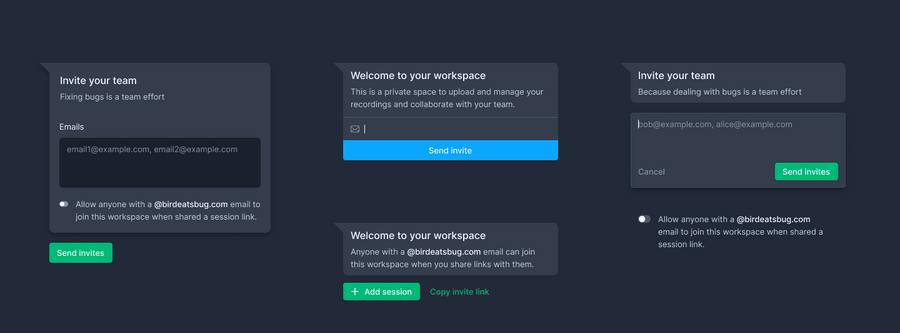
- Adding onboarding flows
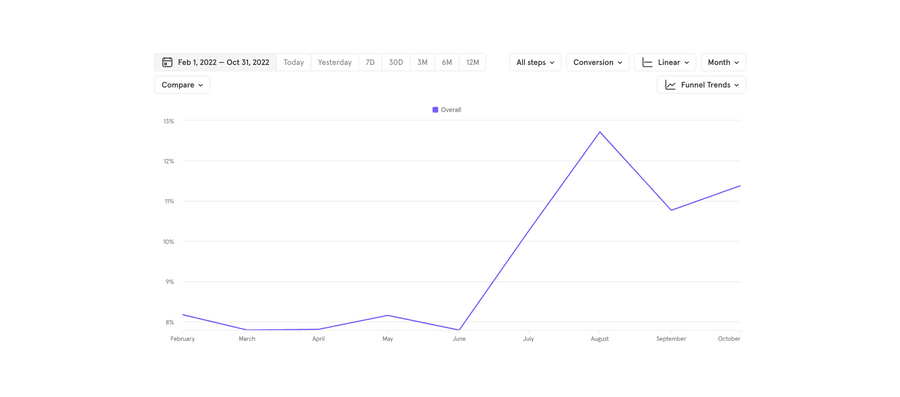
Results: 2X more feature discovery
- New signups now discover the feature 1.5X more than before (13% vs 8%)
- Users who try the feature keep using it 2X more than before (30% vs 15%)
Challenging the activation rate
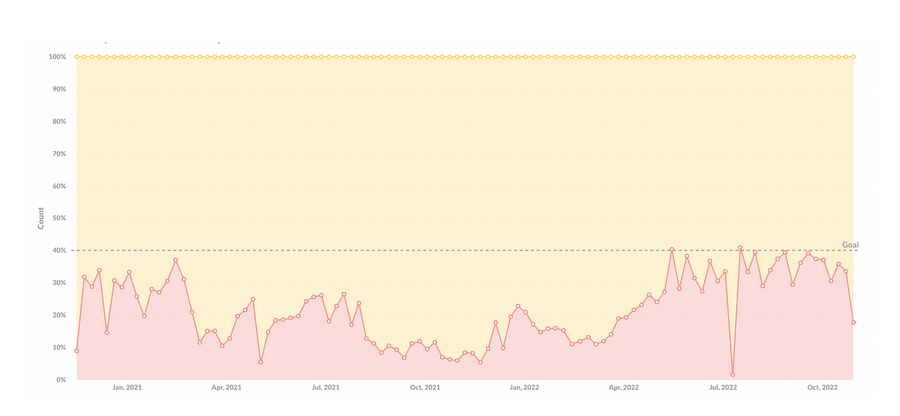
Despite seeing an apparently healthy activation rate of close to 40%, we weren't satisfied with either the usage nor the conversion we were seeing. So we went digging.
Defining a new metric
Analyzing what early tells a workspace that eventually was to become a paid plan customer had, we discarded many actions and features we would have (based on intuition) expected to be clear indicators.
But we found that during those first days:
- They exhibited a first type of action 4X more than the rest
- They exhibited a second type of action 6X more than the rest
- There was a 60% likelihood they had enabled a specific feature
We decided to use them as the defining criteria of a new activation metric and set out to try find the optimum values using common sense and past data:
Once we narrowed down the best values for each criteria, we tried validating these against past data we have collected since we launched. We saw that:
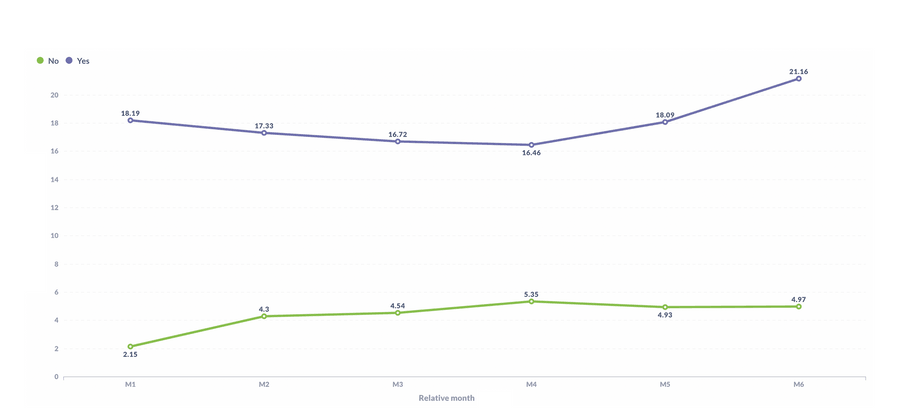
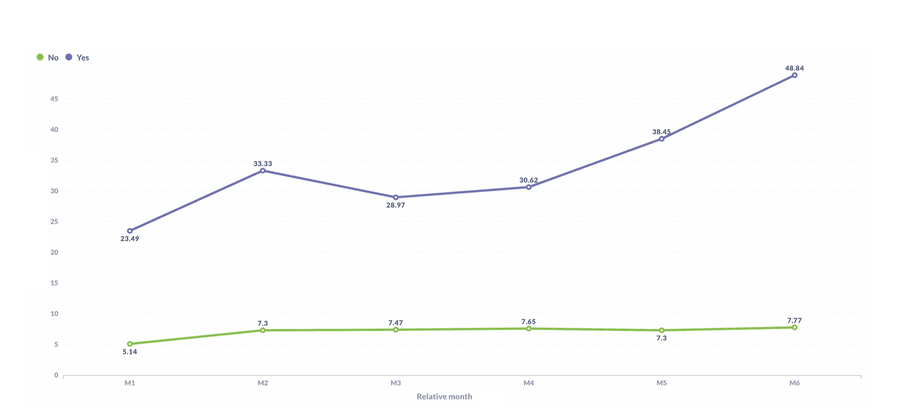
- Workspaces that met the 1st activation criteria displayed 4X more usage by month 6
- Workspaces that met the 2nd activation criteria displayed 7X more usage by month 6
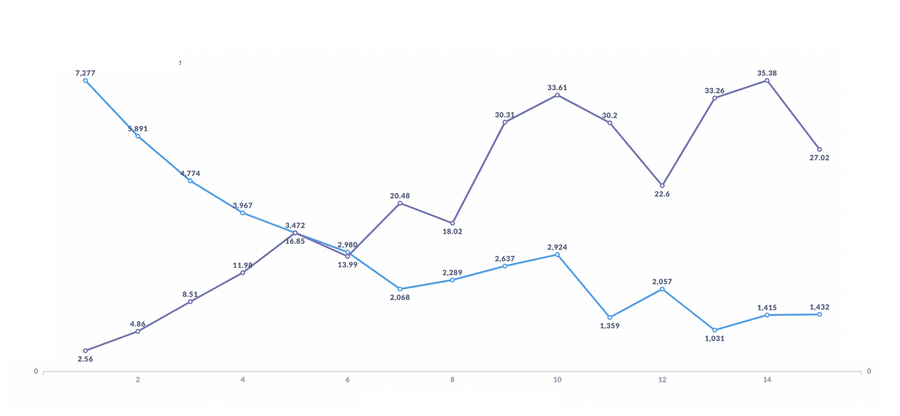
From the perspective of retention, comparing the proposed activation metric against the existing one we saw that:
- 32% of activated workspaces don't survive past Month 1 (down from 49%)
- 40% of activated workspaces are still active by Month 6 (up from 22%)
After sharing all this research with the team, we agreed to experiment with the new activation rate metric and introduce changes to the app to promote those behaviours.
Designing for feature opt-in
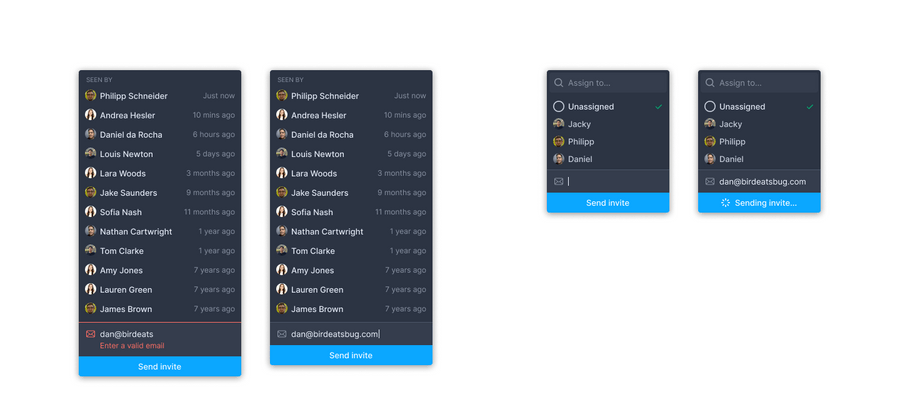
Once we were all aligned, design work started on a wide array of feature improvements and fixes to address the new metric.
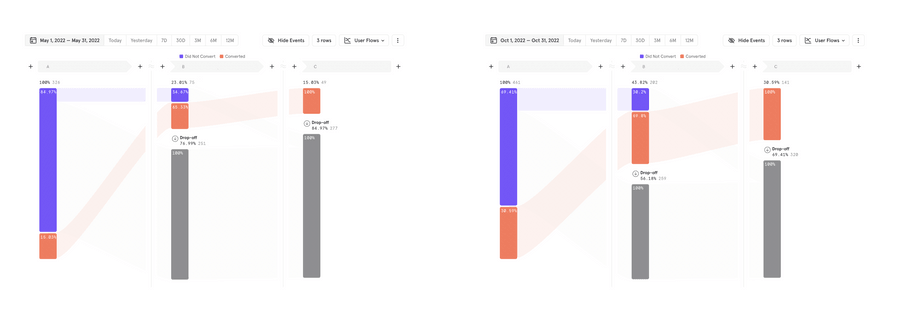
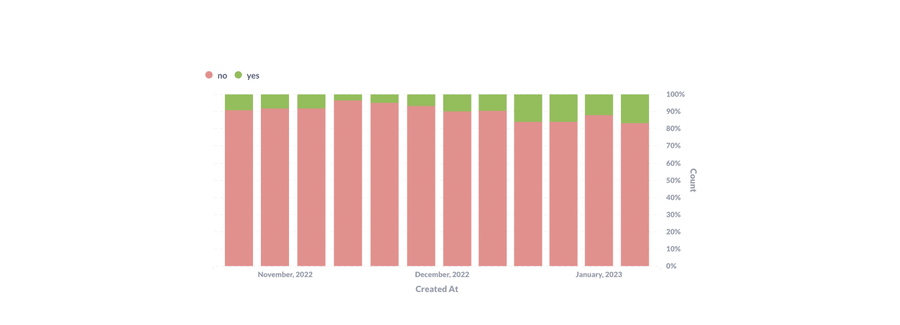
Results: 4X more opt-in to a key feature
- New workspaces now exhibit one desired behaviour during the first days 1.4X more than before (8% vs 19%)
- A key activation feature is being enabled 4X more than before, reaching again all-time high ratios


